![]() Plot > Thermal/Flux
Plot > Thermal/Flux
|
|
Top Previous Next |
|
Activate the Thermal/Flux toolbar – after Map3D Thermal-Fluid Flow BEM analysis.
Parameters for Thermal/Flux Analysis are described in Expansion Coefficient and Conductivity.
This toolbar is meant to provide quick access to thermal/flux components.
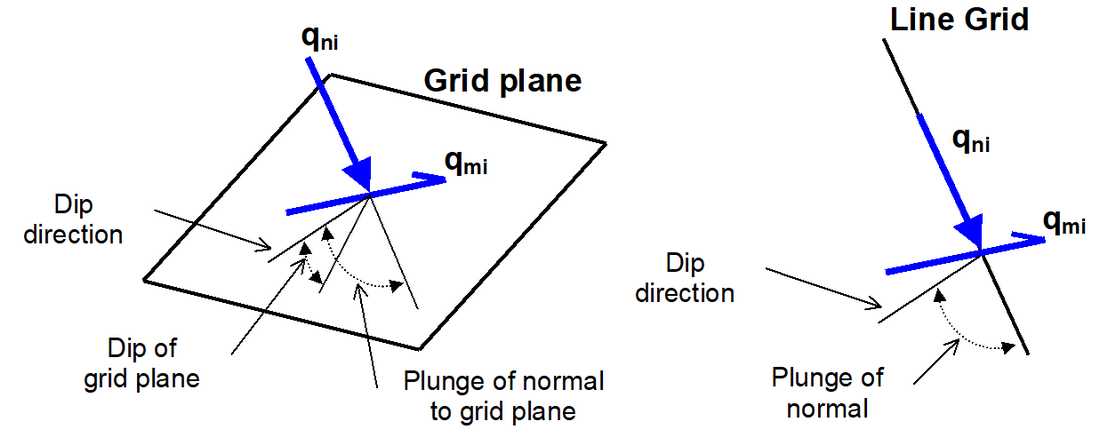
To calculate the in-plane flux, the flux state at each point on the grid plane is reoriented to determine the maximum flux parallel to the grid plane and the flux normal to the plane. Note that qni is oriented normal to the grid plane and parallel to the direction of a line grid.
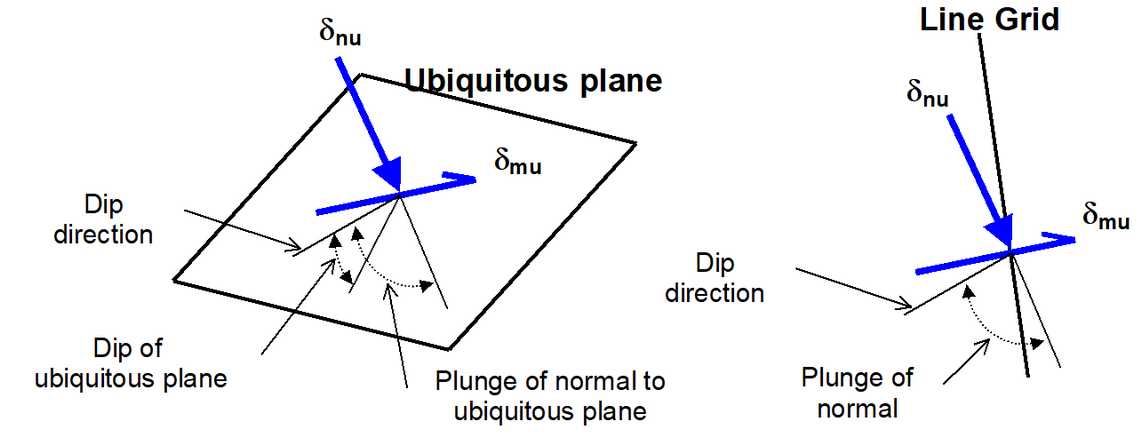
To calculate the ubiquitous-plane #1 flux, the flux state at each point on the grid plane is reoriented to determine the maximum flux parallel to the ubiquitous plane #1 and the flux normal to the plane. Note that δmi is not oriented normal to the grid plane.
•dip direction is measured positive clockwise from the y-axis. •dip of the plane is measured positive down from the horizontal (i.e. the dip direction). •plunge of the normal is measured positive down (i.e. negative up) from the horizontal.
Notes:
The flux toolbar can only be activated after the model building - CAD Stage
The orientation of the ubiquitous shear plane is set using
The contour range is set using
This component can be added to the contour toolbar if desired
The user may find it handy to add the
button to the contouring toolbar for quick access to all flow components.
|