|
Activate the stress toolbar – after Map3D BEM analysis.
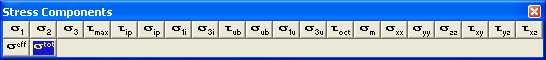
This toolbar is meant to provide quick access to stress components.
 Plot > Stress > S1 Major Principal Stress σ1 Plot > Stress > S1 Major Principal Stress σ1
 Plot > Stress > S2 Intermediate Principal Stress σ2 Plot > Stress > S2 Intermediate Principal Stress σ2
 Plot > Stress > S3 Minor Principal Stress σ3 Plot > Stress > S3 Minor Principal Stress σ3
 Plot > Stress > Tmax Maximum Shear Stress ½(σ1 - σ3) Plot > Stress > Tmax Maximum Shear Stress ½(σ1 - σ3)
 Plot > Stress > Tip In-Plane Shear Stress τip Plot > Stress > Tip In-Plane Shear Stress τip
 Plot > Stress > Sip In-Plane Normal Stress σip Plot > Stress > Sip In-Plane Normal Stress σip
 Plot > Stress > S1i In-Plane Maximum Stress σi1 Plot > Stress > S1i In-Plane Maximum Stress σi1
 Plot > Stress > S3i In-Plane Minimum Stress σi3 Plot > Stress > S3i In-Plane Minimum Stress σi3
 Plot > Stress > Tub Ubiquitous-Plane Shear Stress τub Plot > Stress > Tub Ubiquitous-Plane Shear Stress τub
 Plot > Stress > Sub Ubiquitous-Plane Normal Stress σub Plot > Stress > Sub Ubiquitous-Plane Normal Stress σub
 Plot > Stress > S1u Ubiquitous-Plane Maximum Stress σ1u Plot > Stress > S1u Ubiquitous-Plane Maximum Stress σ1u
 Plot > Stress > S3u Ubiquitous-Plane Minimum Stress σ3u Plot > Stress > S3u Ubiquitous-Plane Minimum Stress σ3u
 Plot > Stress > Toct Octahedral Shear Stress τoct = 1/3 [(σ1 - σ2)² + (σ2 - σ3)² +(σ3 - σ1)²]½ Plot > Stress > Toct Octahedral Shear Stress τoct = 1/3 [(σ1 - σ2)² + (σ2 - σ3)² +(σ3 - σ1)²]½
 Plot > Stress > Smean Mean Stress σmean = 1/3 (σ1 + σ2 + σ3) Plot > Stress > Smean Mean Stress σmean = 1/3 (σ1 + σ2 + σ3)
 Plot > Stress > Sxx Cartesian Stress Component σxx Plot > Stress > Sxx Cartesian Stress Component σxx
 Plot > Stress > Syy Cartesian Stress Component σyy Plot > Stress > Syy Cartesian Stress Component σyy
 Plot > Stress > Szz Cartesian Stress Component σzz Plot > Stress > Szz Cartesian Stress Component σzz
 Plot > Stress > Txy Cartesian Stress Component τxy Plot > Stress > Txy Cartesian Stress Component τxy
 Plot > Stress > Tyz Cartesian Stress Component τyz Plot > Stress > Tyz Cartesian Stress Component τyz
 Plot > Stress > Txz Cartesian Stress Component τxz Plot > Stress > Txz Cartesian Stress Component τxz
 Plot > Stress > Value > Seff Effective Stress σeff Plot > Stress > Value > Seff Effective Stress σeff
 Plot > Stress > Value > Stotal Total Stress σtotal Plot > Stress > Value > Stotal Total Stress σtotal
Notes:
The stress toolbar can only be activated after the model building - CAD Stage
Map3D Analysis Stages
Any of these components can be added to the contour toolbar if desired
 Tools > Configure Contouring Toolbar Tools > Configure Contouring Toolbar
|