Display and contouring of seismicity
Display and contouring of seismicity
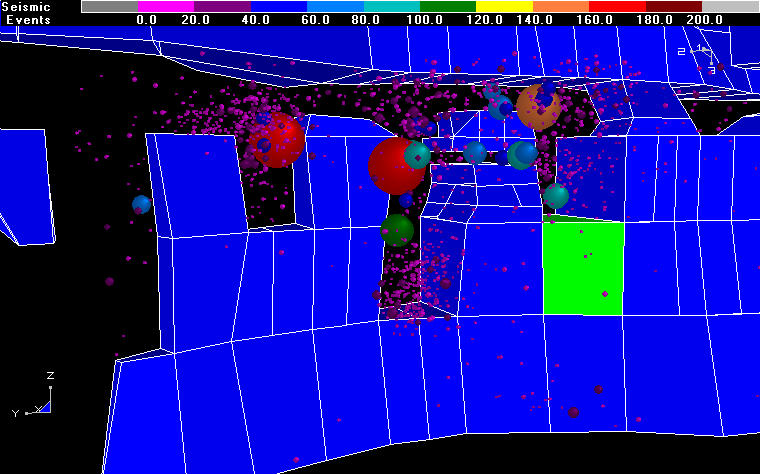
Map3D has many capabilities for visualization of point data. Points can be displayed as light source shaded spheres with diameter and/or colour varying as magnitude. Each point can be tagged with a series of numeric values (e.g. colour, magnitude, orientation etc.) and a text message. Upon clicking on a point, the location, magnitude and text message are displayed on the status bar. This feature can be used to display a database of useful geologic information such as grade, rockmass quality etc.
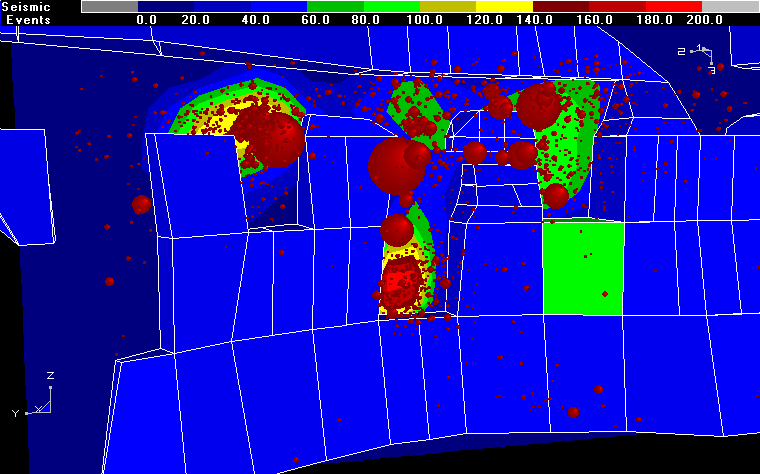
Point data can be contoured on a plane to display density etc. A linear regression routine is included for plane fitting to the data.