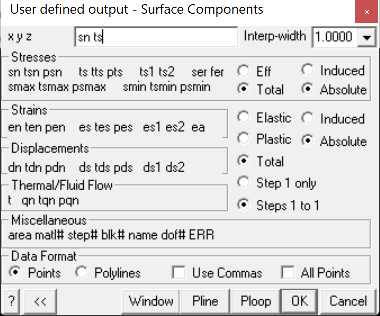
Dumps selected surface components to a text file (*.txt) in a user controlled format.
By default all points on all surfaces are dumped. If you want to dump only a selected set of points use the window function defined below.
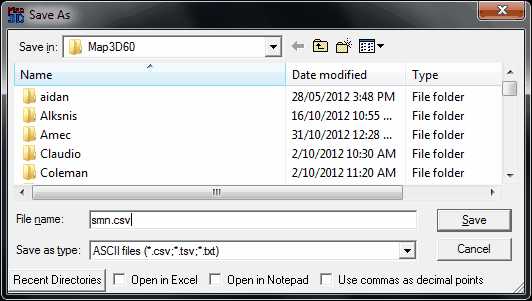
Upon selecting the desired data then OK, you will be prompted for a file name to save the data.
You can select CSV (comma separated/delimited data), TSV (tab separated/delimited data) or TXT (space sepat\rated/delimited data).
You can also specify to automatically open the file in Excel or Notepad.
Note that you should not use CSV files with commas as decimal points.
Stresses:
sn tsn psn stress normal to the surface, its trend and plunge.
ts tts pts maximum shear stress in the plane of the surface, its trend and plunge.
ts1 ts2 shear stress components in the plane of the surface. ts1 is parallel to the first side (i.e. the side defined by x1 y1 z1 – x2 y2 z2). ts2 is perpendicular to ts1 in the direction of the second side (i.e. the side defined by x2 y2 z2 – x3 y3 z3).
ser surface stress error. Iterative solvers function by determining the error in the current solution of each simultaneous equation, then reducing these errors by a process of successive approximations. This parameter indicates the error for each of the equations.
fer failure criterion error. This parameter is only used for non-linear creep analyzes (including fault slip and 3D material non-linearity). This parameter should always be near zero unless some viscosity has been specified and the problem goes non-linear. In this latter case, viscous creep can allow stress states above the failure criterion, thus indicating a lack of static equilibrium. This parameter indicates the viscous stress for each of the equations.
smax tsmax psmax maximum tangential stress, its trend and plunge.
smin tsmin psmin minimum tangential stress, its trend and plunge.
Effective/Total – effective stress or total stress components. These options are only used in Map3D Thermal-Fluid Flow, as this code allows for calculation of steady state pore pressure distributions.
Strains:
en ten pen strain in the direction normal to the surface, its trend and plunge. This parameter is only used for DD planes and is calculated as the normal displacement (closure) divided by the thickness.
es tes pes maximum shear strain in the plane of the surface, its trend and plunge. This parameter is only used for DD planes and is calculated as the shear displacement (ride) divided by the thickness.
es1 es2 shear strain components in the plane of the surface. es1 is parallel to the first side (i.e. the side defined by x1 y1 z1 – x2 y2 z2). es2 is perpendicular to es1 in the direction of the second side (i.e. the side defined by x2 y2 z2 – x3 y3 z3).
Displacements:
dn tdn pdn normal displacement (closure) in the direction normal to the surface, its trend and plunge. This parameter is only used for DD planes. Note that the elastic, plastic or total value can be specified.
ds tds pds maximum shear displacement (ride) in the plane of the surface, its trend and plunge. This parameter is only used for DD planes. Note that the elastic, plastic or total value can be specified.
ds1 ds2 shear displacement (ride) components in the plane of the surface. ds1 is parallel to the first side (i.e. the side defined by x1 y1 z1 – x2 y2 z2). ds2 is perpendicular to ds1 in the direction of the second side (i.e. the side defined by x2 y2 z2 – x3 y3 z3).
Elastic/Plastic/Total elastic, plastic or total strain/displacement components. These options are only used for DD planes.
Miscellaneous:
area the area of the surface.
matl# the number of the material assigned to the surface.
step# the mining step number.
blk# the block number.
name the name of the block surface.
dof# the degree of freedom number.
Data Format
Points data will be written out as a series of points with one point per line.
x1 y1 z1 values1
x2 y2 z2 values2
x3 y3 z3 values3
x4 y4 z4 values4
...
where xi yi zi represent the coordinates of each point,
valuesi represents the values of the list of user selected components at each point. The user defined values will be listed as a comment line (i.e. a line beginning with an asterisk "*") at the beginning of the file.
Polylines data will be written out as a series of polylines in PNT file format
x1 y1 z1 3 values1
x2 y2 z2 2 values2
x3 y3 z3 2 values3
x4 y4 z4 2 values4
...
where xi yi zi represent the coordinates of each point,
3 indicates that this point is the beginning of a new line,
2 indicates that this point is a continuation of the same line,
valuesi represents the values of the list of user selected components at each corner of the polyline. The user defined values will be listed as a comment line (i.e. a line beginning with an asterisk "*") at the beginning of the file.
If linear BEM analysis (Analysis > Options > Linear) was not selected, valuesi are only available at the element centres and hence will only be supplied for the first point. If linear BEM analysis was selected, values are available at each corner and hence will only be supplied for all points.
Other
<< to shrink the dialogue box to small size
>> to expand the dialogue box to large size
Window activates a graphical pick window.
•You will be prompted to select the two corners of the window by picking each with a single mouse click.
•Only grid points enclosed within the window will be included in the dump.
•If you do not use this function all points on all grids are dumped.
•To view the location of the actual contour points enable display of trajectories (Plot > Options > Trajectories). The contour points are located where the trajectories are drawn.
Polyline activates a graphical pick polygon. You will be prompted to select a series of corners to define a polygon by picking each with a single mouse click:
•You must hold the Shift-key down while selecting these points.
•If you define a closed polygonal shape - those contour points enclosed in the polygon will be included.
•If you define an open polygonal shape - a series of points along the length of the polyline will be included.
•To view the location of the actual contour points enable display of trajectories (Plot > Options > Trajectories). The contour points are located where the trajectories are drawn.
•Simple rectangular widow shapes can be defined by holding the Shift-key and dragging open a window (same as with the Window button).
Use Commas data will be written out with commas in place of decimal points.